

We hear it all the time in news reports: “The Dow Jones is up 50 points” or “the Dow closed down 75 points.”
When you hear market updates, do you know what they mean? If you have money invested in the stock market, you should.
What is the Dow Jones?
The Dow Jones or “the Dow” is short for Dow Jones Industrial Average (DJIA). It’s an index that helps people get a sense for how the stock market is performing. The Dow provides a snapshot of how the stock prices of 30 U.S. companies, as a group, are performing.
The stock of these 30 companies make up the Dow Jones Industrial Average:*
- 3M
- American Express
- Apple
- Boeing
- Caterpillar
- Chevron
- Cisco Systems
- Coca-Cola
- DowDuPont
- ExxonMobil
- General Electric
- Goldman Sachs
- The Home Depot
- IBM
- Intel
- Johnson & Johnson
- JPMorgan Chase
- McDonald’s
- Merck
- Microsoft
- Nike
- Pfizer
- Procter & Gamble
- Travelers
- UnitedHealth Group
- United Technologies
- Verizon
- Visa
- Walmart
- Walt Disney
* as of Nov. 6, 2017
Why should I care about the Dow?
By keeping track of the status and general direction of the Dow you can get a sense for how the market is behaving. Just knowing that can help reduce the potential anxiety you might feel when you check the performance of your investments.
Knowing what the Dow is at any given time is of almost no value without some perspective. If you hear the Dow is at 23,000, you would need to know what it was yesterday, last week or last month in order for that number have any meaning. That’s why we often here the Dow referenced as being up or down. It helps us understand the general trend to market is headed at a given point in time.
Example (not actual figures):
- Monday: Dow closed at 20,000
- Tuesday: Dow closed at 20,075, ↑ 75 points (0.375%)
- Wednesday: Dow closed at 19,900, ↓ 175 points (0.872%)
Following the Dow is sort of like tracking daily temperatures. Rising numbers mean things are heating up; falling numbers mean it’s cooling off. If the market is trending upward, you can generally expect your stock investments to trend upward, too.
By keeping track of the status and general direction of the Dow Jones average, you can get a sense for how the stock market is behaving. That awareness can help prepare you for what to expect, and potentially reduce your anxiety, when you check your account balances.
Historical snapshot of the Dow Jones Industrial Average Oct 1972 – Oct 2017
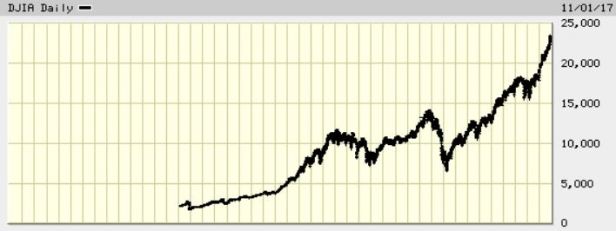
Dow Jones Index milestones:
- November 1, 1972: 1,003.16. Closed above 1,000 (1,003.16) for the first time in history.
- January 8, 1987: 2,002.25. Closed above 2,000 for first time in history.
- October 19, 1987 – 1,738.74. Dubbed “Black Monday” as a result of the 508 point (22.6%) one-day drop – the largest in the Dow Jones’ in history to date.
- November 21, 1995: 5,023.55. First time closing above 5,000.
- March 29, 1999: 10,006.78. Closed above 10,000 for the first time ever.
- January 14, 2000: 11,722.98. Closed at a level never reached before. Peak of the Dot-com bubble.
- September 17, 2001: 8,920.70 Closed down 684.81 points (7.1%) on the first day after 9/11. The second largest one-day point drop in the Dow’s history.
- October 9, 2002: 7,286.27; lowest point in 5 years.
- September 29, 2008: 10,365.45 Largest one-day point decline ever, 778 points (6.98%).
- March 9, 2009: 6,547.05 – Lowest close in the slump period that would earn the nickname Great Recession
- October 14, 2009: 10,015.86 – Broke through the 10,000 level for first time in a year; a 52.9% rise from 12-year low in March 2009.
- May 7, 2013: 15,056. Closed above 15,000 for first time ever.
- January 25, 2017: 20,068.5. Closed above 20,000 for first time ever.
- November 7, 2017: 23557.23. Date this post was prepared.
Companies included in the Dow are very large household names that represent a variety of industries. Some people feel that it’s not an accurate representation of what the stock market is doing as a whole. Thankfully, the DJIA is not the only index that helps us gauge the stock market.
Other commonly quoted stock market indices:
S&P 500: Index of 500 large companies having common stock listed on the NYSE or NASDAQ.
NASDAQ composite: Tracks approximately 4,000 stocks, all of which are traded on the Nasdaq exchange.
Russell 3,000: Measures performance of the 3,000 largest publicly held companies incorporated in America.
EAFE index: Stands for Europe, Australasia and Far East – a broad index that represents the performance of foreign stock markets.
Can I invest in the Dow Jones?
Ah, good question. Technically, the answer is no. However, there are funds you can invest in that are managed to mimic the performance of the Dow Jones index. (That’s another lesson for another post.) One more approach is to invest in the stock of some of the 30 companies that make up the Dow. This should be attempted only after you are pretty knowledgeable about the ins and outs of the stock market, and can bear to lose money in the short term.
Quick recap
Keeping up with the Dow Jones index is a simple way to stay in touch with what the stock market is doing. Although you can’t invest in the Dow directly, if you invest in stocks or stock mutual funds, you can generally expect them to move in the same direction as the Dow – sometimes up and other times down.

I agree. I think it is important to have an idea of the market and its history. I also think that observing volume is very important. If the market goes down by more than 1% what was the volume doing. Did it dry up intraday on the lows? Did it recover on decent volume before the close? If there is a rally after a correction is there good volume on the upside or not? I know it can be difficult for people who have full time jobs to watch this sort of thing and even to get the right information. Some people also get more anxious if they start following the market closely. But some knowledge of what your investments are doing and a basic understanding or the market is wise.
LikeLike